
10 Best Survey Response Analysis Tools for 2025
Discover the right survey analysis tools for your team. Compare features, pros + cons, pricing, and more in this comprehensive guide.
Survey response analysis tools transform raw data into actionable insights, helping organizations make data-driven decisions based on customer feedback, employee sentiment, and market research. Whether you need advanced statistical testing for academic research or AI-powered text analysis for open-ended responses, these tools deliver the analytical power and visualization capabilities to uncover patterns, measure impact, and present findings that drive strategic action.
In this post, I draw from extensive research and hands-on evaluation of survey analysis platforms to compile this comprehensive guide, featuring a curated list of the best survey response analysis tools for transforming survey data into meaningful insights—where advanced analytics, automated reporting, and powerful visualizations aren’t just nice to have, they’re essential.
What are Survey Response Analysis Tools?
Survey response analysis tools are specialized platforms designed to process, analyze, and visualize survey data to extract meaningful insights. Unlike basic spreadsheet applications, these tools offer advanced capabilities like statistical significance testing, crosstab analysis, sentiment analysis of open-ended responses, automated theme discovery, predictive analytics, and interactive dashboards. They’re essential for market researchers, customer experience teams, HR departments, and any organization that needs to transform survey responses into strategic decisions.
Overview
Finding the perfect survey response analysis tool can transform how you interpret feedback, measure satisfaction, and make strategic decisions. After extensive research and testing, I’ve compiled this guide featuring the top 10 survey analysis tools that excel in statistical analysis, text analytics, and data visualization capabilities.
Here’s our pick of the 10 best survey response analysis tools reviewed:
-
Qualtrics – Best for enterprise experience management
-
Displayr – Best for market research and automated reporting
-
Tableau – Best for advanced data visualization
-
IBM SPSS Statistics – Best for statistical analysis and academic research
-
Microsoft Power BI – Best for business intelligence dashboards
-
Typeform – Best for all-in-one survey platform
-
MonkeyLearn – Best for text analytics and sentiment analysis
-
Q Research Software – Best for survey crosstabs and reporting
-
Microsoft Excel – Best for basic analysis and spreadsheets
-
Google Looker Studio – Best for free data visualization and reports
Detailed Reviews
1. Qualtrics
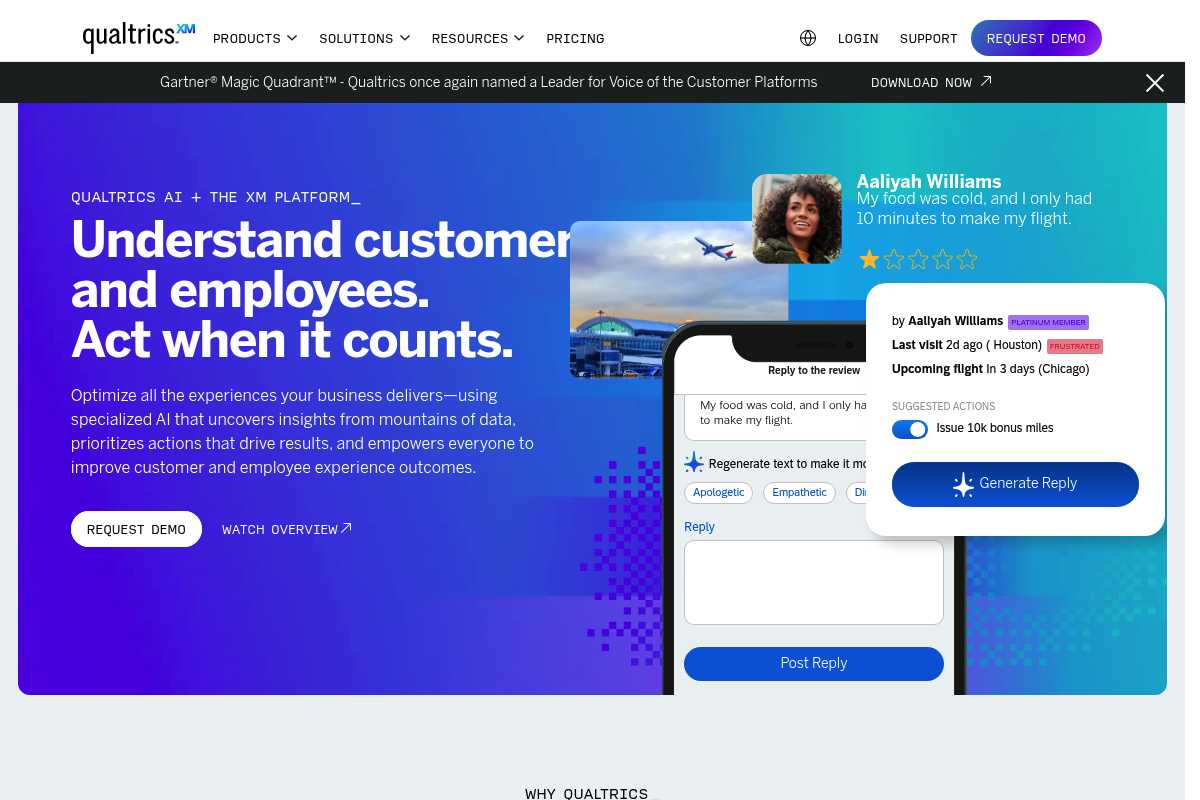
What Is Qualtrics?
Qualtrics is the world’s leading experience management platform, trusted by over 13,000 brands and 75% of the Fortune 500. It provides enterprise-grade tools for analyzing customer, employee, product, and brand experience data with advanced statistical analysis, AI-powered insights, and comprehensive visualization capabilities—perfect for organizations that need robust, scalable survey analysis across all departments.
Key Features
- AI-Powered Text Analytics (Text iQ): Automatically analyze open-ended responses with sentiment analysis and theme discovery
- Stats iQ: Automated statistical testing that recommends appropriate tests based on your data
- Advanced Analysis Tools: Regression, TURF, conjoint analysis, MaxDiff, and more
- Crosstab Analysis: Dynamic cross-tabulation with statistical significance testing
- Predictive Analytics: Forecast trends and identify drivers of key metrics
- Video Feedback Analysis: Summarize video responses using generative AI
- Real-time Dashboards: Interactive dashboards with drill-down capabilities
- Automated Reporting: Schedule and distribute reports automatically
- SPSS Integration: Export to SPSS, R, and other statistical software
- 23+ Question Types: Including heat maps, hot spots, and file uploads
- API Access: REST API for system integration
- Enterprise Security: SOC-2, GDPR, and HIPAA compliance available
Pros
- ✅ Most comprehensive analysis platform available
- ✅ AI-powered analytics with Text iQ and Stats iQ
- ✅ Advanced statistical tools for professional research
- ✅ Scales to enterprise-level data volumes
- ✅ Excellent integration with CRM and BI tools
- ✅ Automated insights and recommendations
- ✅ Strong security and compliance features
- ✅ 24/7 support for enterprise customers
Cons
- ❌ Very expensive for small organizations ($420+/month)
- ❌ Steep learning curve for all features
- ❌ Complex pricing structure (not transparent)
- ❌ Can be overkill for simple survey analysis
- ❌ Advanced features require training
- ❌ Limited customer support on lower tiers
Pricing
- Free Plan: 500 total responses (limited features)
- Strategic Research: $420/month (1,000 responses shared across users)
- Enterprise: Custom pricing (5,000+ responses)
- Note: Annual billing required; volume pricing available
- Free Trial: 30-day trial with premium features
2. Displayr
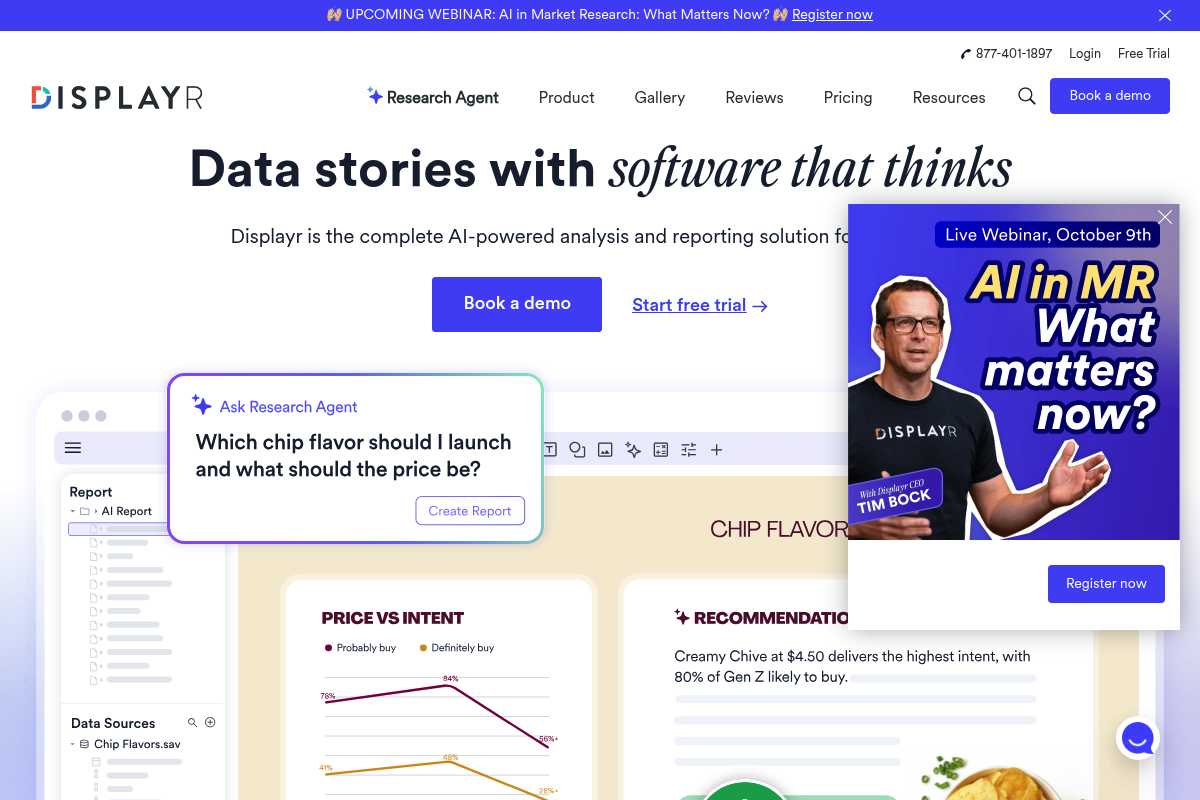
What Is Displayr?
Displayr is an all-in-one cloud-based analysis and reporting platform designed specifically for market researchers. It combines data cleaning, statistical analysis, visualization, and automated reporting in a single workspace, with powerful AI features including Research Agents that can analyze data and generate insights automatically—ideal for research professionals who need to move from raw data to client-ready reports quickly.
Key Features
- AI Research Agents: Upload data and AI automatically analyzes, creates charts, and generates strategic recommendations
- Automated Text Analysis: AI-powered theme discovery and sentiment analysis for open-ended responses
- Advanced Statistical Tests: Automatically applied based on data type and structure (60+ tests)
- Crosstab Automation: Create thousands of tables automatically with drag-and-drop
- Auto-Updating Reports: Change data and all analyses and reports update automatically
- PowerPoint Integration: Export editable charts and tables directly to PowerPoint
- Interactive Dashboards: Build shareable, auto-updating dashboards
- R and Python Integration: Write custom code for advanced analyses
- MaxDiff & Conjoint: Built-in advanced analysis techniques
- Machine Learning: Clustering, regression, segmentation, and more
- Data Visualization: 100+ chart types and customizable visualizations
- Collaboration Tools: Multiple users can work on documents simultaneously
Pros
- ✅ Purpose-built for survey and market research data
- ✅ AI automates time-consuming analysis tasks
- ✅ Dramatically faster than traditional workflows (50%+ time savings)
- ✅ All-in-one: data prep, analysis, and reporting in one place
- ✅ No coding required for most analyses
- ✅ Automatic statistical testing with smart defaults
- ✅ Excellent PowerPoint export (editable charts)
- ✅ Strong customer support and training resources
Cons
- ❌ Custom pricing (not transparent on website)
- ❌ Learning curve for advanced features
- ❌ Can slow down with very large datasets
- ❌ R/Python knowledge needed for some customizations
- ❌ Additional AI usage fees for heavy users
- ❌ Primarily focused on research (not general BI)
Pricing
- Professional: Custom pricing (contact for quote)
- Enterprise: Custom pricing with SSO and regional servers
- AI Package: 200M tokens included per license; $250 for additional package
- Free Trial: Available upon request
- Note: Pricing based on users and feature requirements
3. Tableau
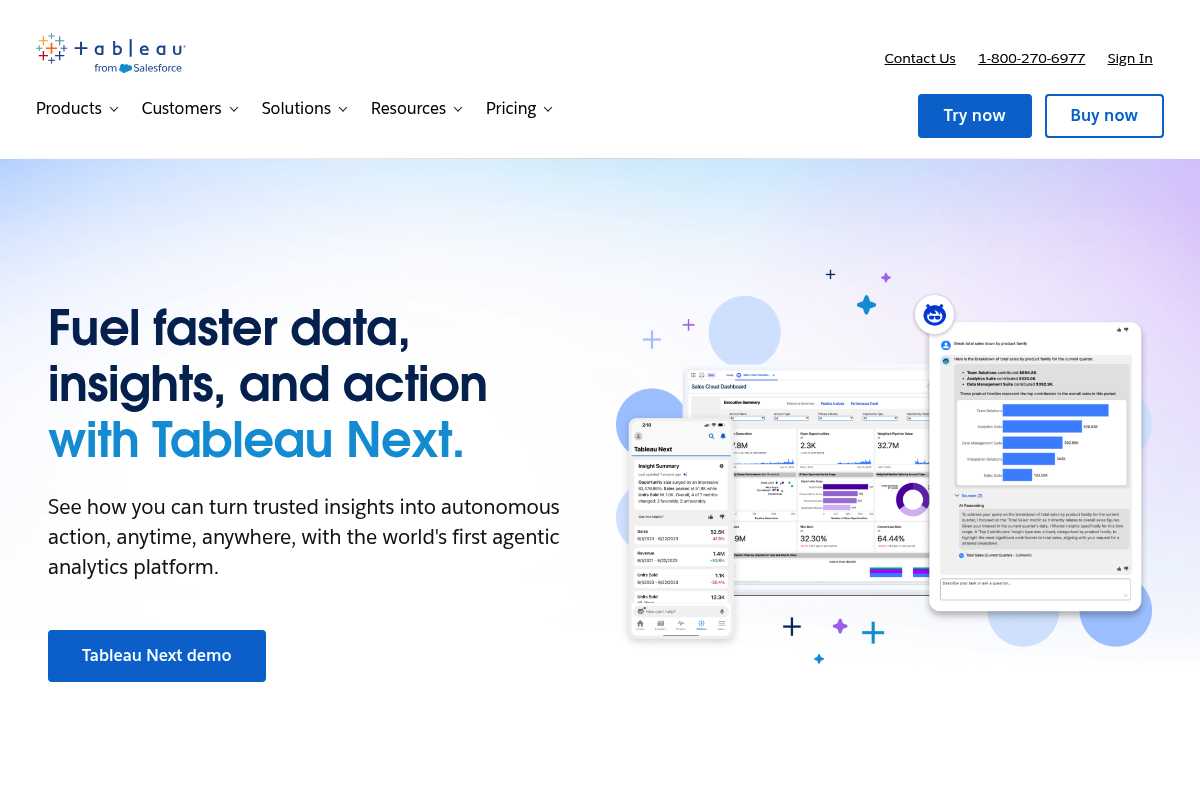
What Is Tableau?
Tableau is the world’s leading data visualization platform, enabling anyone to transform survey data into beautiful, interactive dashboards and reports. With Einstein AI-powered insights, drag-and-drop analytics, and connection to virtually any data source, Tableau helps organizations create compelling visual stories from survey responses—perfect for teams that need to share insights across departments and make data accessible to non-technical stakeholders.
Key Features
- Einstein AI Insights: AI-powered insights built into visualizations
- Tableau Pulse: AI-driven metrics and automated insights
- Drag-and-Drop Analytics: No coding required for visual analysis
- Survey Data Pivoting: Quickly restructure survey data for analysis
- 100+ Data Connectors: Connect to SPSS, Excel, CSV, databases, and more
- Interactive Dashboards: Click-to-filter and drill-down capabilities
- Real-Time Collaboration: Share and collaborate on visualizations
- Mobile Analytics: View and interact with dashboards on any device
- Natural Language Processing: Ask questions about your data in plain English
- Statistical Functions: Built-in calculations and forecasting
- Custom Visualizations: Create unique charts tailored to your data
- Automated Refresh: Schedule data updates automatically
Pros
- ✅ Best-in-class data visualization capabilities
- ✅ Intuitive drag-and-drop interface
- ✅ Works with survey data and any other data source
- ✅ AI-powered insights with Einstein
- ✅ Extensive visualization library
- ✅ Strong community and learning resources
- ✅ Mobile-responsive dashboards
- ✅ Scales from individual to enterprise
Cons
- ❌ Expensive for full capabilities ($75/user/month)
- ❌ Requires separate survey data preparation
- ❌ Limited built-in statistical testing
- ❌ Can be slow with very large datasets
- ❌ AI features only on Tableau+ premium tier
- ❌ Not specifically designed for survey analysis
Pricing
- Tableau Viewer: $15/user/month (view-only access)
- Tableau Explorer: $42/user/month (explore and interact)
- Tableau Creator: $75/user/month (full capabilities)
- Tableau+: $161/user/month (AI features and advanced tools)
- Free Trial: 14-day trial available
- Note: Annual billing; enterprise discounts available
4. IBM SPSS Statistics
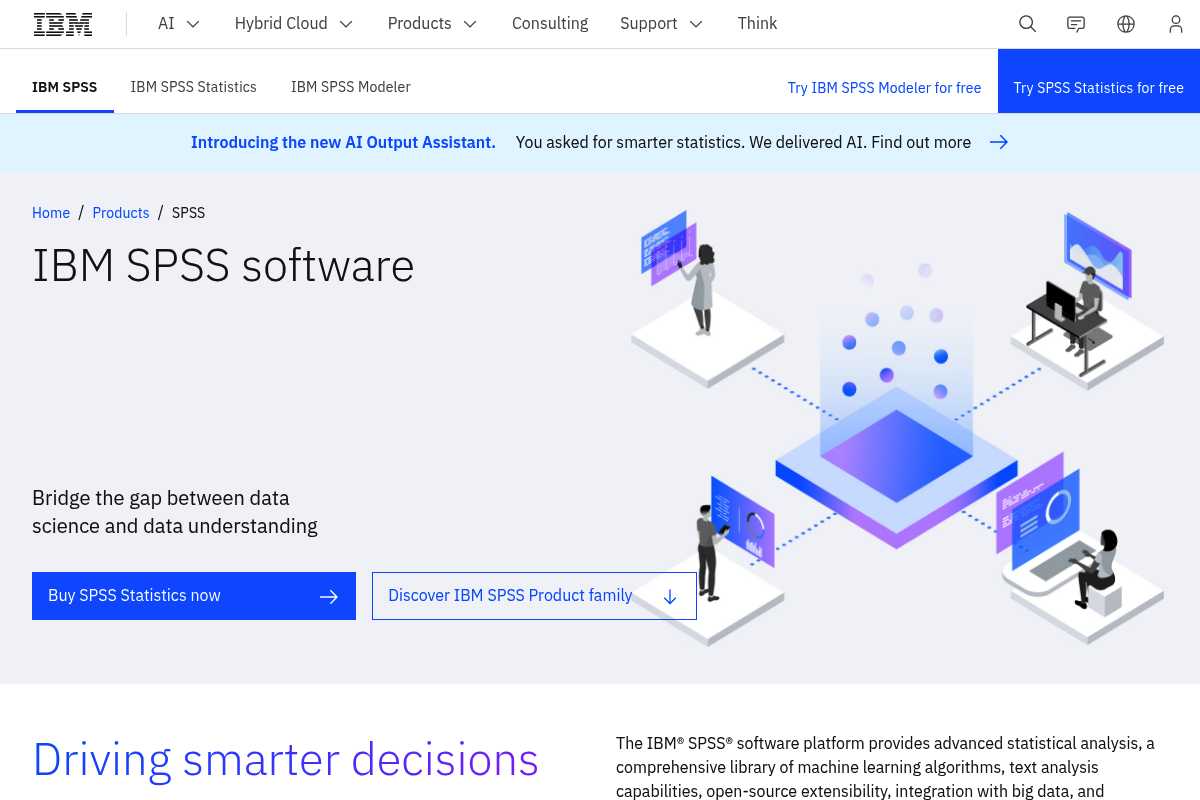
What Is IBM SPSS Statistics?
IBM SPSS Statistics is the gold standard for statistical analysis in academic research, social sciences, and professional market research. With comprehensive statistical procedures, an intuitive point-and-click interface, and the ability to handle complex survey data with ease, SPSS is the tool of choice for researchers who need rigorous, publication-ready statistical analysis—ideal for universities, research institutions, and data scientists.
Key Features
- Comprehensive Statistical Tests: 100+ statistical procedures including regression, ANOVA, factor analysis, and more
- Survey Data Management: Handle complex survey structures, weights, and missing values
- Custom Tables: Create professional crosstabs with advanced formatting
- Bootstrapping: Advanced resampling techniques for robust estimates
- Data Preparation Tools: Clean and transform data efficiently
- Syntax Editor: Save and reuse analysis commands for reproducibility
- SPSS Modeler: Predictive analytics and data mining capabilities
- Charts and Graphs: Publication-quality visualizations
- Missing Values Analysis: Handle incomplete data appropriately
- Complex Samples: Analyze data from complex survey designs
- Integration: Export to Excel, Word, PowerPoint, and other formats
- Academic Version: Discounted pricing for students and educators
Pros
- ✅ Industry standard for statistical analysis
- ✅ Comprehensive range of statistical tests
- ✅ Excellent for academic and scientific research
- ✅ Point-and-click interface (no coding required)
- ✅ Syntax feature for reproducible research
- ✅ Handles complex survey data structures
- ✅ Strong documentation and help resources
- ✅ Academic discounts available
Cons
- ❌ Expensive ($99+/month subscription)
- ❌ Steep learning curve for advanced features
- ❌ Not ideal for creating dashboards or reports
- ❌ Limited data visualization capabilities
- ❌ Slower performance with very large datasets
- ❌ Dated user interface
- ❌ Additional modules sold separately
Pricing
- Subscription: Starting at $99/month
- Base Package: Statistical analysis and reporting
- Add-ons: Custom Tables ($additional), Advanced Statistics ($additional), Complex Sampling ($additional)
- Academic: Discounted pricing for students and universities
- Free Trial: 14-day free trial available
- Perpetual License: Available for purchase
5. Microsoft Power BI
What Is Microsoft Power BI?
Microsoft Power BI is a business intelligence platform that transforms survey data into interactive visualizations and dashboards. With AI-powered analytics, seamless integration with Microsoft Office and hundreds of data sources, and the ability to share insights across organizations, Power BI makes survey analysis accessible to business users—perfect for organizations already using the Microsoft ecosystem.
Key Features
- AI-Powered Insights: Automated insights with Copilot and Q&A
- Interactive Dashboards: Click-to-filter and drill-down capabilities
- Power Query: Transform and clean survey data efficiently
- DAX Calculations: Create custom metrics and measures
- Survey Data Integration: Connect to Qualtrics, Google Forms, and more
- Real-Time Analytics: Monitor survey responses as they arrive
- Mobile Apps: View dashboards on iOS and Android
- Natural Language Q&A: Ask questions about your data in plain English
- Custom Visualizations: 300+ visualization types available
- Collaboration: Share reports via SharePoint, Teams, or email
- Scheduled Refresh: Automatic data updates
- Row-Level Security: Control data access by user
Pros
- ✅ Affordable pricing (free tier available)
- ✅ AI-powered insights and natural language Q&A
- ✅ Excellent integration with Microsoft ecosystem
- ✅ Strong data transformation capabilities
- ✅ Large library of custom visualizations
- ✅ Easy to share dashboards across organization
- ✅ Mobile-responsive reports
- ✅ Active community and extensive resources
Cons
- ❌ Learning curve for Power Query and DAX
- ❌ Limited built-in statistical testing
- ❌ Survey data requires manual preparation
- ❌ Not designed specifically for research
- ❌ AI features require premium licensing
- ❌ Can be complex for non-technical users
Pricing
- Power BI Desktop: Free (local use only)
- Power BI Pro: $10/user/month (sharing and collaboration)
- Power BI Premium: $20/user/month (advanced features)
- Power BI Embedded: Custom pricing for developers
- Free Trial: 60-day trial available
- Note: Part of Microsoft 365 subscriptions
6. Typeform
What Is Typeform?
Typeform is a popular survey platform known for its engaging, conversational forms. Beyond survey creation, it offers powerful built-in analysis features including AI-powered text analysis, sentiment analysis, automated theme discovery, statistical testing, and customizable reports—ideal for organizations that want an all-in-one solution for creating surveys and analyzing responses without switching platforms.
Key Features
- AI Text Analysis: Automatically categorize open-ended responses into themes
- Sentiment Analysis: Classify responses as positive, negative, or neutral
- Word Clouds: Visual representation of frequently used words
- Statistical Significance Testing: Identify meaningful differences in responses
- Crosstab Analysis: Compare responses across demographics
- Trend Analysis: Track changes over time with multiple survey waves
- Custom Dashboards: Build interactive reports with filters
- Data Export: Download to SPSS, Excel, CSV, PDF
- Benchmarking: Compare your results to industry averages
- Survey Templates: 200+ expert-designed templates
- Audience Panel: Access to millions of survey respondents
- Integration: Connect to Salesforce, HubSpot, Tableau, and more
Pros
- ✅ All-in-one platform (survey creation + analysis)
- ✅ AI-powered text and sentiment analysis included
- ✅ Easy to use for non-technical users
- ✅ Quick survey deployment and analysis
- ✅ Access to respondent panel for research
- ✅ Strong mobile app for analyzing on the go
- ✅ Affordable pricing with free option
- ✅ Excellent customer support
Cons
- ❌ Limited advanced statistical testing
- ❌ AI features only on higher-tier plans
- ❌ Response limits on lower tiers (100/month on Basic)
- ❌ Less flexibility than dedicated analysis tools
- ❌ Custom branding requires premium plans
- ❌ Not ideal for complex research methodologies
Pricing
- Basic: Free (10 questions, 10 responses per survey)
- Standard: $25/month (unlimited questions, 1,000 responses/year)
- Advantage: $32/month (unlimited surveys, advanced logic, exports)
- Premier: $99/month (AI text analysis, advanced analytics)
- Enterprise: Custom pricing (dedicated support, HIPAA)
- Free Trial: Limited free plan available
7. MonkeyLearn
What Is MonkeyLearn?
MonkeyLearn is a no-code AI platform specialized in text analytics, enabling organizations to extract insights from open-ended survey responses, customer feedback, and support tickets. Using machine learning for sentiment analysis, topic classification, and entity extraction, MonkeyLearn turns unstructured text into structured, actionable data—perfect for teams focused on understanding the “why” behind survey responses.
Key Features
- AI Sentiment Analysis: Automatically detect positive, negative, or neutral sentiment
- Topic Classification: Categorize responses by theme or subject
- Entity Extraction: Identify keywords, features, and named entities
- Custom ML Models: Train your own models without coding
- Pre-Built Models: Ready-to-use classifiers for common use cases
- Text Visualization: Word clouds and theme frequency charts
- Workflow Automation: Integrate with Zendesk, Google Sheets, Zapier
- Multi-Language Support: Analyze text in multiple languages
- Historical Tracking: Monitor sentiment and topics over time
- API Access: Build custom integrations and applications
- Data Import: Connect to surveys, support tickets, reviews, social media
- Dashboard Analytics: Visualize insights with interactive charts
Pros
- ✅ Specialized in text and sentiment analysis
- ✅ No coding required to build ML models
- ✅ Pre-built models save setup time
- ✅ Excellent for open-ended survey responses
- ✅ Strong integration ecosystem (Zapier, Zendesk, etc.)
- ✅ Multi-language text analysis
- ✅ Custom models adapt to your specific needs
- ✅ Good documentation and tutorials
Cons
- ❌ Expensive for text-only analysis ($299/month)
- ❌ Limited to 100 responses on free plan
- ❌ Doesn’t handle quantitative survey data
- ❌ Requires integration with other tools for full analysis
- ❌ Learning curve for training custom models
- ❌ Not a complete survey analysis solution
Pricing
- Free Plan: 300 queries/month (limited features)
- Starter: $299/month (5,000 queries/month)
- Business: Custom pricing (higher volumes)
- Enterprise: Custom pricing (dedicated support, SLA)
- Free Trial: 14-day free trial available
- Note: Pricing based on query volume
8. Q Research Software
What Is Q Research Software?
Q Research Software is a Windows desktop application built specifically for survey data analysis and crosstab reporting. It automatically formats survey data, makes creating and analyzing crosstabs easy, and seamlessly integrates with PowerPoint for exporting editable charts and tables—ideal for market researchers who need fast, professional crosstab analysis without the complexity of enterprise platforms.
Key Features
- Automatic Data Normalization: Automatically structures survey data for analysis
- Fast Crosstab Creation: Build tables quickly with drag-and-drop
- Statistical Testing: Automated significance testing on all crosstabs
- PowerPoint Integration: Export editable charts and tables directly
- Advanced Analysis: Regression, MaxDiff, conjoint, TURF, and more
- Data Cleaning Tools: Identify and fix data quality issues
- Weight Variables: Apply and manage survey weights
- Custom Calculations: Create new variables and metrics
- Table Automation: Generate hundreds of tables automatically
- Filter Management: Apply complex filters and segments
- Chart Customization: Professional, publication-ready visualizations
- SPSS Compatibility: Read and write SPSS data files
Pros
- ✅ Built specifically for survey analysis
- ✅ Fast crosstab creation and analysis
- ✅ Automatic statistical significance testing
- ✅ Excellent PowerPoint export (editable charts)
- ✅ Handles complex survey data structures
- ✅ One-time purchase option available
- ✅ No ongoing subscription costs (perpetual license)
- ✅ Good for professional market researchers
Cons
- ❌ Windows desktop only (no cloud/Mac version)
- ❌ Custom pricing (contact for quote)
- ❌ Dated user interface
- ❌ Steeper learning curve than web-based tools
- ❌ Limited collaboration features
- ❌ Requires installation and setup
Pricing
- Pricing: Custom (contact for quote)
- Model: Perpetual license or subscription
- Free Trial: Available upon request
- Note: Pricing varies by user count and features
- Displayr Alternative: Cloud-based version with more features
9. Microsoft Excel
What Is Microsoft Excel?
Microsoft Excel is the world’s most ubiquitous spreadsheet software, used by billions of people for data analysis. While not designed specifically for surveys, Excel offers pivot tables, charts, basic statistical functions, and formulas that can handle straightforward survey analysis—perfect for small-scale surveys, quick analysis, and organizations with limited budgets or simple analytical needs.
Key Features
- Pivot Tables: Quickly summarize and cross-tabulate survey data
- Charts & Graphs: 100+ chart types for visualization
- Statistical Functions: Mean, median, standard deviation, correlation, regression
- Data Filtering: Sort and filter responses by criteria
- Conditional Formatting: Highlight patterns in data
- Formulas: Create custom calculations and metrics
- Data Validation: Ensure data quality and consistency
- SPSS Import: Open SPSS data files (with add-in)
- Power Query: Clean and transform data (desktop version)
- Collaboration: Share workbooks via OneDrive or SharePoint
- Templates: Survey analysis templates available
- Macros: Automate repetitive tasks (VBA)
Pros
- ✅ Widely available and familiar to most users
- ✅ Very affordable (free with Microsoft 365)
- ✅ No learning curve for basic functions
- ✅ Flexible and customizable
- ✅ Works offline (desktop version)
- ✅ Good for small-scale analysis
- ✅ Can handle both quantitative and qualitative data
- ✅ Extensive online tutorials and resources
Cons
- ❌ Not designed for survey analysis specifically
- ❌ Manual work required for complex analysis
- ❌ No automated statistical testing
- ❌ Limited to basic descriptive statistics
- ❌ Difficult to scale with large datasets
- ❌ No built-in text or sentiment analysis
- ❌ Risk of errors with manual calculations
- ❌ Poor collaboration for complex projects
Pricing
- Excel Online: Free (limited features)
- Microsoft 365 Personal: $7/month (includes Excel desktop)
- Microsoft 365 Family: $10/month (up to 6 users)
- Microsoft 365 Business: $12.50/user/month
- Excel Desktop: One-time purchase available ($160)
- Free Trial: 30-day trial of Microsoft 365
10. Google Looker Studio

What Is Google Looker Studio?
Google Looker Studio (formerly Data Studio) is a free data visualization and dashboard tool that transforms survey data into interactive, shareable reports. With connections to Google Forms, Sheets, and hundreds of other data sources, Looker Studio enables anyone to create professional-looking dashboards without cost—ideal for small businesses, nonprofits, and teams with limited budgets who need basic survey visualization.
Key Features
- Free Forever: No cost for unlimited reports and dashboards
- Google Forms Integration: Direct connection to survey responses
- Real-Time Dashboards: Auto-updating visualizations
- Drag-and-Drop Builder: No coding required
- Custom Visualizations: Create charts tailored to your data
- Interactive Filters: Allow viewers to explore data
- Collaboration: Share reports with stakeholders
- Mobile-Responsive: Dashboards adapt to any screen size
- Data Blending: Combine multiple data sources
- Calculated Fields: Create custom metrics
- Scheduled Emails: Automate report distribution
- Embed Reports: Add dashboards to websites
Pros
- ✅ Completely free with no limits
- ✅ Seamless Google Forms integration
- ✅ Easy to learn and use
- ✅ Real-time data updates
- ✅ Good visualization options
- ✅ Excellent sharing and collaboration
- ✅ No software installation required
- ✅ Mobile-responsive dashboards
Cons
- ❌ No built-in statistical testing
- ❌ Limited analytical capabilities
- ❌ No sentiment or text analysis
- ❌ Basic compared to paid tools
- ❌ Requires Google account
- ❌ Limited data transformation features
- ❌ Not designed for complex research
- ❌ Fewer visualization options than Tableau
Pricing
- Pricing: Free (no cost)
- Requirements: Google account
- Storage: Unlimited dashboards and reports
- Note: Part of Google Workspace ecosystem
Comparison Chart
| Tool | Starting Price | AI Analysis | Best For |
|---|---|---|---|
| Qualtrics | $420/month | ✅ Yes | Enterprise experience management |
| Displayr | Custom pricing | ✅ Yes | Market research & automated reporting |
| Tableau | $15/month | ✅ Yes | Advanced data visualization |
| IBM SPSS Statistics | $99/month | ❌ No | Statistical analysis & academic research |
| Microsoft Power BI | Free / $10/month | ✅ Yes | Business intelligence dashboards |
| Typeform | Free / $25/month | ✅ Yes | All-in-one survey platform |
| MonkeyLearn | $299/month | ✅ Yes | Text analytics & sentiment analysis |
| Q Research Software | Custom pricing | ❌ No | Survey crosstabs & reporting |
| Microsoft Excel | Free / $7/month | ⚠️ Limited | Basic analysis & spreadsheets |
| Google Looker Studio | Free | ❌ No | Free data visualization & reports |
How to Choose the Right Survey Response Analysis Tool
Selecting the right survey analysis tool depends on your specific use case and requirements. Consider these key factors:
1. Analysis Complexity
- Basic descriptive statistics: Excel, Google Looker Studio
- Advanced statistical testing: SPSS, Qualtrics, Displayr
- Predictive analytics: Qualtrics, SPSS, Displayr
- Text and sentiment analysis: MonkeyLearn, Qualtrics, Displayr
2. Use Case Specificity
- Academic research: SPSS (gold standard), Qualtrics, Q Research Software
- Market research: Displayr, Q Research Software, Qualtrics
- Customer experience: Qualtrics, Power BI
- Business intelligence: Tableau, Power BI, Looker Studio
- Text analysis only: MonkeyLearn
3. Integration Requirements
- Microsoft ecosystem: Power BI, Excel (Microsoft 365)
- Google ecosystem: Looker Studio, Google Sheets
- Survey platforms: Qualtrics (integrated)
- SPSS compatibility: Displayr, Q Research, Qualtrics
- CRM integration: Qualtrics, Power BI
4. Budget Considerations
- Free options: Google Looker Studio, Excel Online, Power BI Desktop
- Affordable ($10-$100/month): Power BI Pro, Excel, SPSS
- Mid-range ($100-$500/month): Qualtrics, MonkeyLearn, Displayr
- Enterprise (custom pricing): Qualtrics Enterprise, Displayr Enterprise, Q Research
5. Technical Expertise
- Beginner-friendly: Google Looker Studio, Excel, Power BI
- Moderate skill: Tableau, Displayr, MonkeyLearn
- Advanced/technical: SPSS, Q Research Software, Qualtrics (advanced features)
6. Data Volume
- Small (<1,000 responses): Excel, Google Looker Studio
- Medium (1,000-100,000): Power BI, Displayr, Qualtrics
- Large (100,000+): Qualtrics, Tableau, SPSS, Displayr
7. Reporting Needs
- Interactive dashboards: Tableau, Power BI, Looker Studio, Displayr, Qualtrics
- PowerPoint export: Displayr, Q Research, Qualtrics
- Automated reporting: Qualtrics, Displayr
- Publication-ready: SPSS, Displayr, Qualtrics
8. AI and Automation
- AI text analysis: Qualtrics (Text iQ), MonkeyLearn, Displayr
- Automated insights: Qualtrics (Stats iQ), Tableau (Einstein), Power BI (Copilot)
- Theme discovery: MonkeyLearn, Qualtrics, Displayr
- Sentiment analysis: MonkeyLearn, Qualtrics, Displayr
Selection Criteria
To create this list, I evaluated survey response analysis tools based on:
Essential Analytical Capabilities
- Statistical testing: Significance testing, correlation, regression analysis
- Crosstab analysis: Cross-tabulation with filtering and segmentation
- Text analysis: AI-powered theme discovery and sentiment analysis
- Data visualization: Chart types, customization, and interactivity
- Advanced analytics: Predictive modeling, conjoint, MaxDiff, segmentation
Key Features Evaluated
- Data integration: Ability to import from survey platforms, SPSS, Excel, databases
- Automation: Auto-updating reports, scheduled exports, batch processing
- Collaboration: Sharing, commenting, version control
- AI capabilities: Natural language processing, automated insights, theme discovery
- Export options: PowerPoint, Excel, PDF, SPSS, web dashboards
- Mobile access: View and interact with analyses on mobile devices
Additional Considerations
- Pricing model: Subscription vs. perpetual license vs. free
- Scalability: Handling large datasets and complex analyses
- Support quality: Documentation, training, customer service
- Learning curve: Time to proficiency for typical users
- Security: Data encryption, compliance certifications (SOC-2, GDPR, HIPAA)
- Reliability: Platform stability and performance
Frequently Asked Questions
What is a survey response analysis tool?
A survey response analysis tool is software designed to process, analyze, and visualize survey data to extract meaningful insights. These tools offer features like statistical testing, crosstab analysis, sentiment analysis, data visualization, and automated reporting. They’re essential for transforming raw survey responses into actionable business intelligence and strategic decisions.
What’s the difference between survey creation tools and analysis tools?
Survey creation tools (like Typeform, Google Forms) focus on designing surveys and collecting responses. Survey analysis tools specialize in processing and interpreting the data after collection. Some platforms like Qualtrics are all-in-one solutions that handle both creation and analysis, while others like SPSS, Tableau, and Displayr focus exclusively on analyzing data from any source.
Do I need specialized survey analysis software or can I use Excel?
Excel works well for:
- Small datasets (<1,000 responses)
- Basic descriptive statistics
- Simple pivot tables and charts
- Quick, informal analysis
Specialized tools are better for:
- Large datasets requiring statistical significance testing
- Advanced analytics (regression, conjoint, predictive modeling)
- AI-powered text and sentiment analysis
- Automated reporting and dashboards
- Professional market research
For serious research or large-scale feedback programs, specialized tools save significant time and provide more robust insights.
What are the best tools for analyzing open-ended survey responses?
The top tools for text analysis include:
- MonkeyLearn: Best for dedicated AI text and sentiment analysis ($299/month)
- Qualtrics Text iQ: Enterprise-grade text analytics with theme discovery (part of Qualtrics)
- Displayr: Automated theme discovery with AI ($custom pricing)
These tools use AI and natural language processing to automatically categorize responses, detect sentiment, and identify themes at scale.
Can survey analysis tools integrate with my existing survey platform?
Yes, most analysis tools integrate with popular survey platforms:
- Qualtrics: Built-in analysis (no integration needed)
- Tableau & Power BI: Connect to Qualtrics, Google Forms, Typeform
- Displayr: Direct API connections to major survey platforms
- SPSS: Import from most platforms via CSV, Excel, or SPSS format
- MonkeyLearn: Integrates via Zapier with Google Forms, Typeform, etc.
Most tools support CSV/Excel import, so you can analyze data from any survey platform.
How much do survey analysis tools cost?
Survey analysis tool pricing varies widely:
- Free: Google Looker Studio, Excel Online, Power BI Desktop
- Affordable ($10-$100/month): Power BI Pro ($10), SPSS ($99)
- Mid-range ($100-$500/month): Tableau ($75), MonkeyLearn ($299), Qualtrics ($420)
- Enterprise (custom): Qualtrics Enterprise, Displayr, Q Research Software
- One-time purchase: SPSS perpetual license, Q Research Software
Choose based on your budget, data volume, and required features.
What’s the best tool for academic research and statistical analysis?
For rigorous academic and scientific research:
- SPSS: Industry gold standard for statistical analysis ($99/month)
- Qualtrics: Comprehensive with Stats iQ and advanced testing ($420+/month)
- Displayr: Professional research platform with automation (custom pricing)
- R or Python: Free, open-source options requiring programming skills
SPSS is the most widely accepted in academic publications due to its comprehensive statistical procedures and reproducible syntax.
Can I create dashboards and share insights with stakeholders?
Yes, excellent dashboard tools include:
- Tableau: Best-in-class interactive dashboards ($75/user/month)
- Power BI: Professional BI dashboards ($10-$20/user/month)
- Qualtrics: Built-in dashboards with drill-down ($420+/month)
- Displayr: Auto-updating research dashboards (custom pricing)
- Google Looker Studio: Free, shareable dashboards
All these tools allow you to create interactive, shareable dashboards that update automatically when new survey data arrives.
Do I need coding skills to analyze survey data?
No coding required:
- Qualtrics: Automated insights, no code needed
- Tableau/Power BI: Drag-and-drop dashboards
- Excel: Formulas and pivot tables (basic skills)
Some coding helpful:
- Displayr: Optional R/Python for advanced customization
- SPSS: Syntax for reproducible research (optional)
Advanced users only:
- R: Free but requires programming
- Python: Free but requires programming
Most modern survey analysis tools are designed for non-technical users, so coding is optional, not required.
What’s the best free survey analysis tool?
For completely free analysis:
- Google Looker Studio: Best free dashboards and visualization
- Excel Online: Basic analysis and pivot tables
- Power BI Desktop: Powerful BI tool (desktop only)
For budget-conscious teams, Google Looker Studio offers the best free capabilities for creating professional dashboards and visualizing survey data.
How do AI-powered survey analysis tools work?
AI-powered tools use:
- Natural Language Processing (NLP): Understands meaning in text responses
- Machine Learning: Identifies patterns and themes automatically
- Sentiment Analysis: Classifies responses as positive, negative, or neutral
- Automated Insights: Suggests important findings and statistical tests
- Theme Discovery: Groups similar responses into categories
Tools like Qualtrics Text iQ, MonkeyLearn, and Displayr’s Research Agent can analyze thousands of open-ended responses in minutes, saving hours of manual coding time.
Final Thoughts
Choosing the right survey response analysis tool depends on whether you need basic visualization or advanced statistical analysis, your budget, and your technical expertise. For most organizations, I recommend:
- Qualtrics for enterprises needing comprehensive experience management with AI-powered analytics across all departments
- Displayr for market researchers who need fast, automated analysis and professional client reporting
- Tableau for organizations prioritizing stunning visualizations and dashboard sharing across teams
- SPSS for academic researchers and data scientists requiring rigorous statistical analysis
- Power BI for Microsoft-centric organizations needing affordable business intelligence
For organizations with specific needs:
- Text and sentiment analysis: MonkeyLearn (specialized AI), Qualtrics (enterprise)
- Academic research: SPSS (gold standard), Qualtrics, Displayr
- Budget-conscious: Google Looker Studio (free), Power BI ($10/month), Excel
- All-in-one solution: Qualtrics (enterprise)
- Market research professionals: Displayr (automated reporting), Q Research (crosstabs)
Remember that the best survey analysis tool is one that matches your analytical requirements. If you’re doing rigorous statistical testing, prioritize tools like SPSS or Qualtrics. If you’re focused on visualizing trends and sharing insights, choose Tableau or Power BI. For text-heavy surveys with open-ended responses, MonkeyLearn or tools with AI text analysis are essential.
Most platforms offer free trials—take advantage of these to test analysis workflows with your actual survey data before committing to a platform.
About This Guide
This guide was created through extensive research of survey analysis tools and platforms, analyzing statistical capabilities, AI features, pricing, and user reviews. All information is current as of October 2025. Survey analysis software features and pricing change frequently, so always verify details on the vendor’s official website and test the analytical capabilities before committing to a platform.


